TL;DR
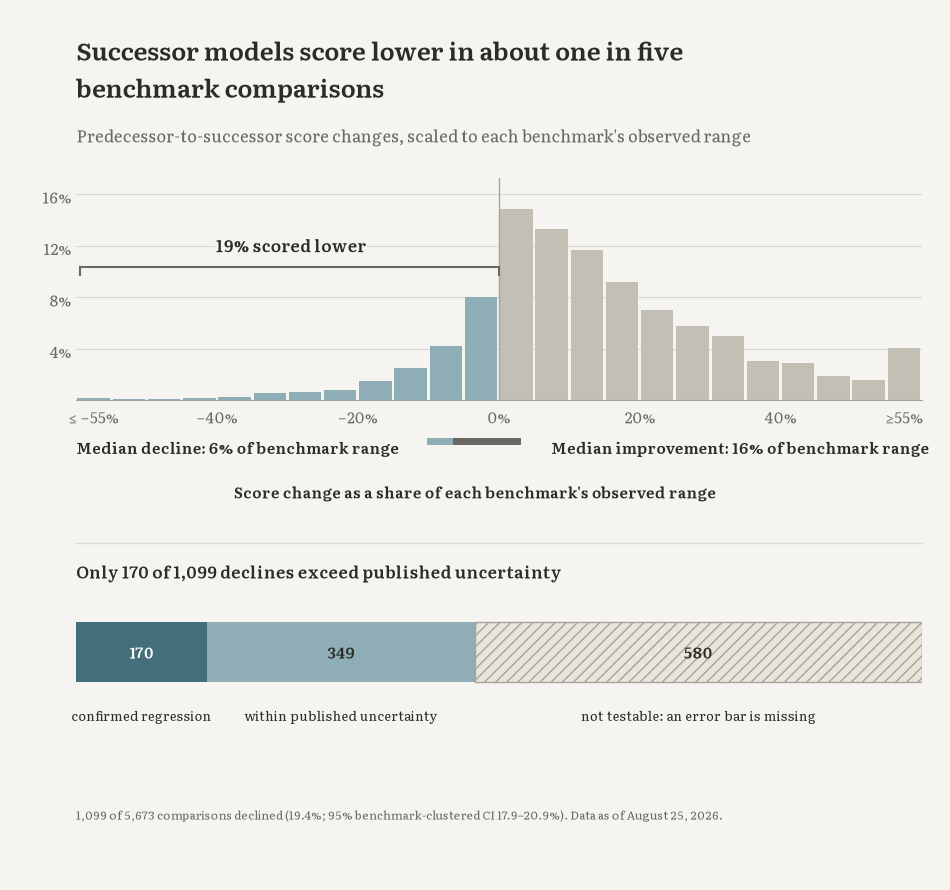
- We surveyed declines in performance between successive models. Nearly a fifth of included benchmark scores fell some amount across pairs of successive models. The median fall was 6.5% of the benchmark’s range.
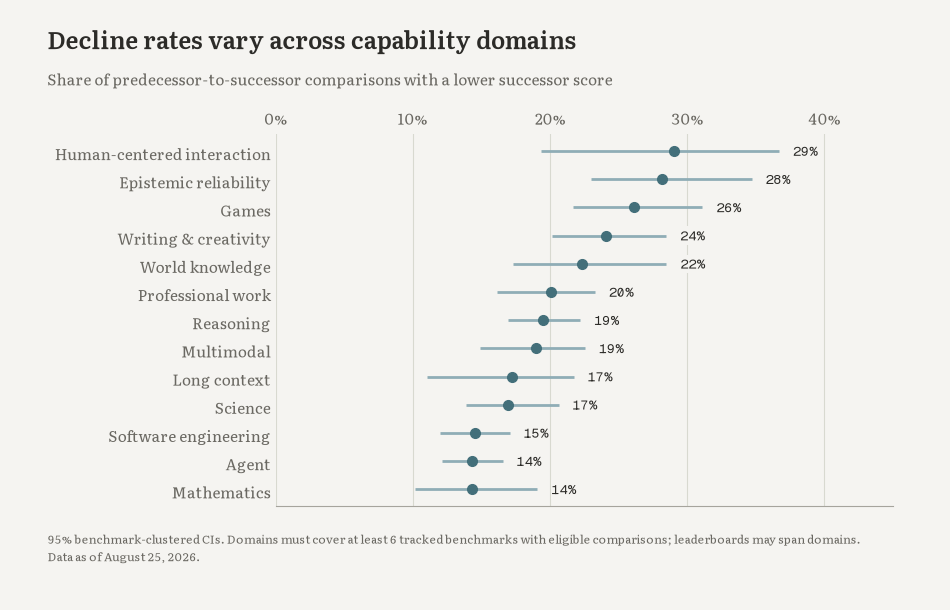
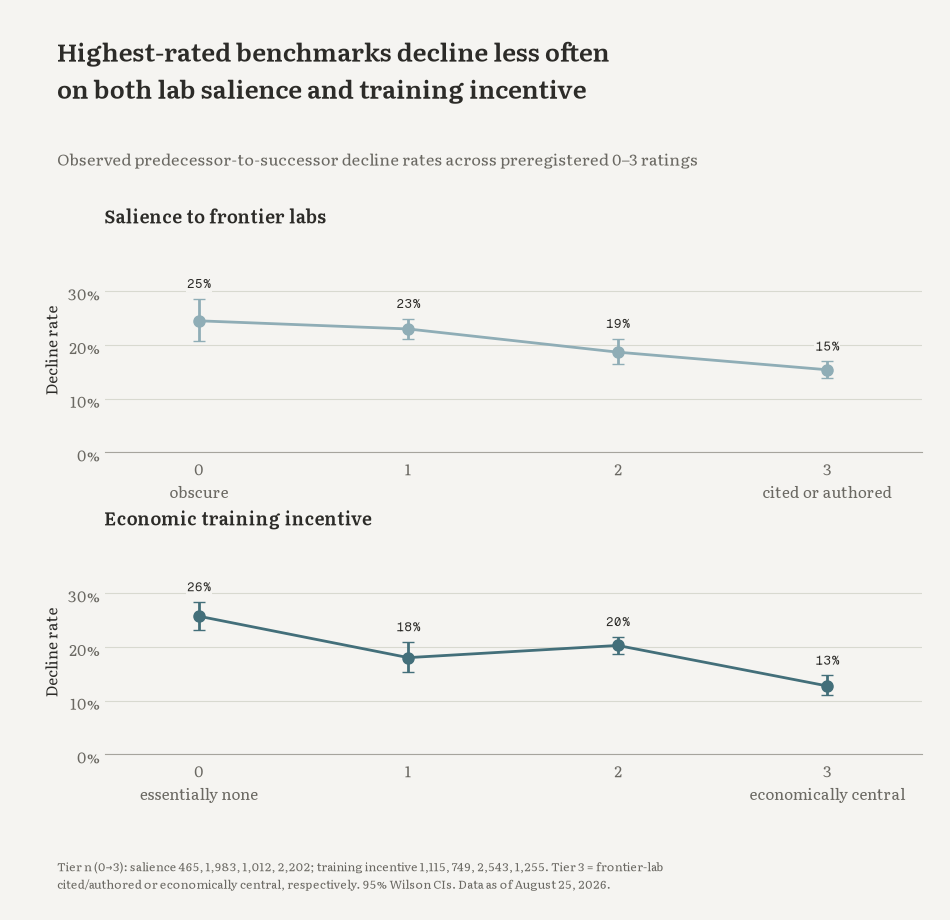
- Declines are not uniform: as you’d expect, they are rarer in coding and STEM than in e.g. writing and creativity. Broadly, the more prominent a benchmark is (and the more economically valuable the underlying tasks are) the less likely it is to regress.
- We believe this is survivorship bias: model checkpoints that regress on prominent and economically valuable benchmarks are shelved in favour of model checkpoints which don’t regress.
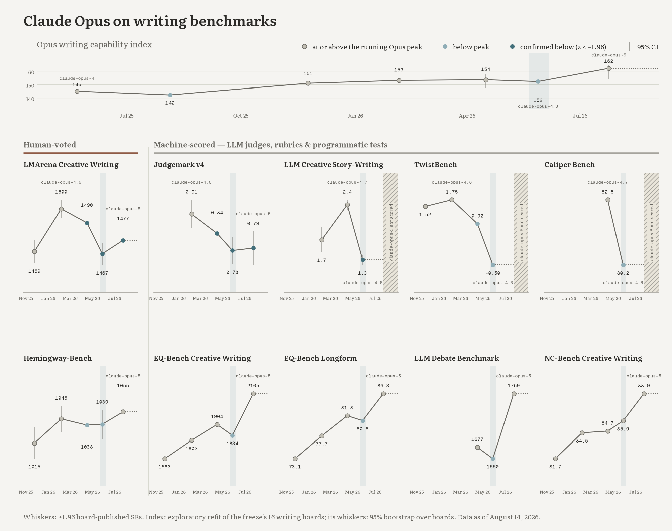
- We looked at writing capabilities across Claude Opus models. On a range of proxy measures, Claude Opus 4.8 appears to be generally worse than its predecessors. Separately, Claude Opus 5 also isn’t an improvement, when the scope is restricted to human-evaluated benchmarks.
- Since we didn’t run these evals ourselves, we can’t distinguish spurious declines from actual regressions when a benchmark’s leaderboard fails to report usable error bars (as was the case in about three in five included benchmark leaderboards).
- We don’t think this reveals any sharp trade-off in the development of frontier LLMs.
- Data here.
When was the last time you used a model more than 4 months old? Probably 4 months ago.
And week on week, companies come out with models that surpass the old ones on so many metrics it feels natural to simply call them “smarter” models. It is also normal to hear things like “intelligence is doubling every 7 months”.
So revealed preference and benchmark results seem to show that new models are a general improvement over old models. But do new models exhibit improvement on all metrics?
No: some capabilities in new frontier models regress.. In April last year, for instance, OpenAI released an update to its GPT-4o model that exhibited such excessive sycophancy it had to be recalled out of concern for users’ mental health. Beyond a handful of such high-profile anecdotes, and an old competition, little is known about when and how model regressions happen. To systematically study this, we aggregated performance data across model releases from more than 10 major AI labs over a period of roughly two years, tracking reported performance on more than 350 benchmark leaderboards.
About three in five benchmark leaderboards don’t report usable error bars. So in the following we distinguish benchmark score declines (a lower score on a benchmark) and true capability regressions (a drop where we’re confident something is actually happening, wheremodel capability the variance is accounted for).
A few concrete examples#
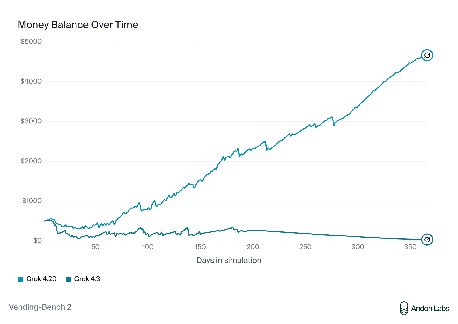
To illustrate this phenomenon, here’s a couple of examples. Consider Andon Labs’ Vending-Bench 2: Grok 4.3, a “new pre-trained model matching the scale of Grok 4.20 with an improved architecture” ended on $35.26 (i.e. it made a 93% loss on its initial $500 float) compared to Grok 4.20 which ended on $4,662.85 (900% return). Despite being the newer and theoretically better architected model, Grok 4.3 scores far below its predecessor on this benchmark. This is the kind of between-generation decline we aim to survey.
Alternatively, consider performance of GPT models on OpenAI’s Proof Q&A benchmark, which “evaluates AI models on 20 internal research and engineering bottlenecks encountered at OpenAI”. Even on a benchmark developed in-house by a frontier lab, and one that directly measures capabilities the lab itself depends on, successor models can fall short of their predecessors.
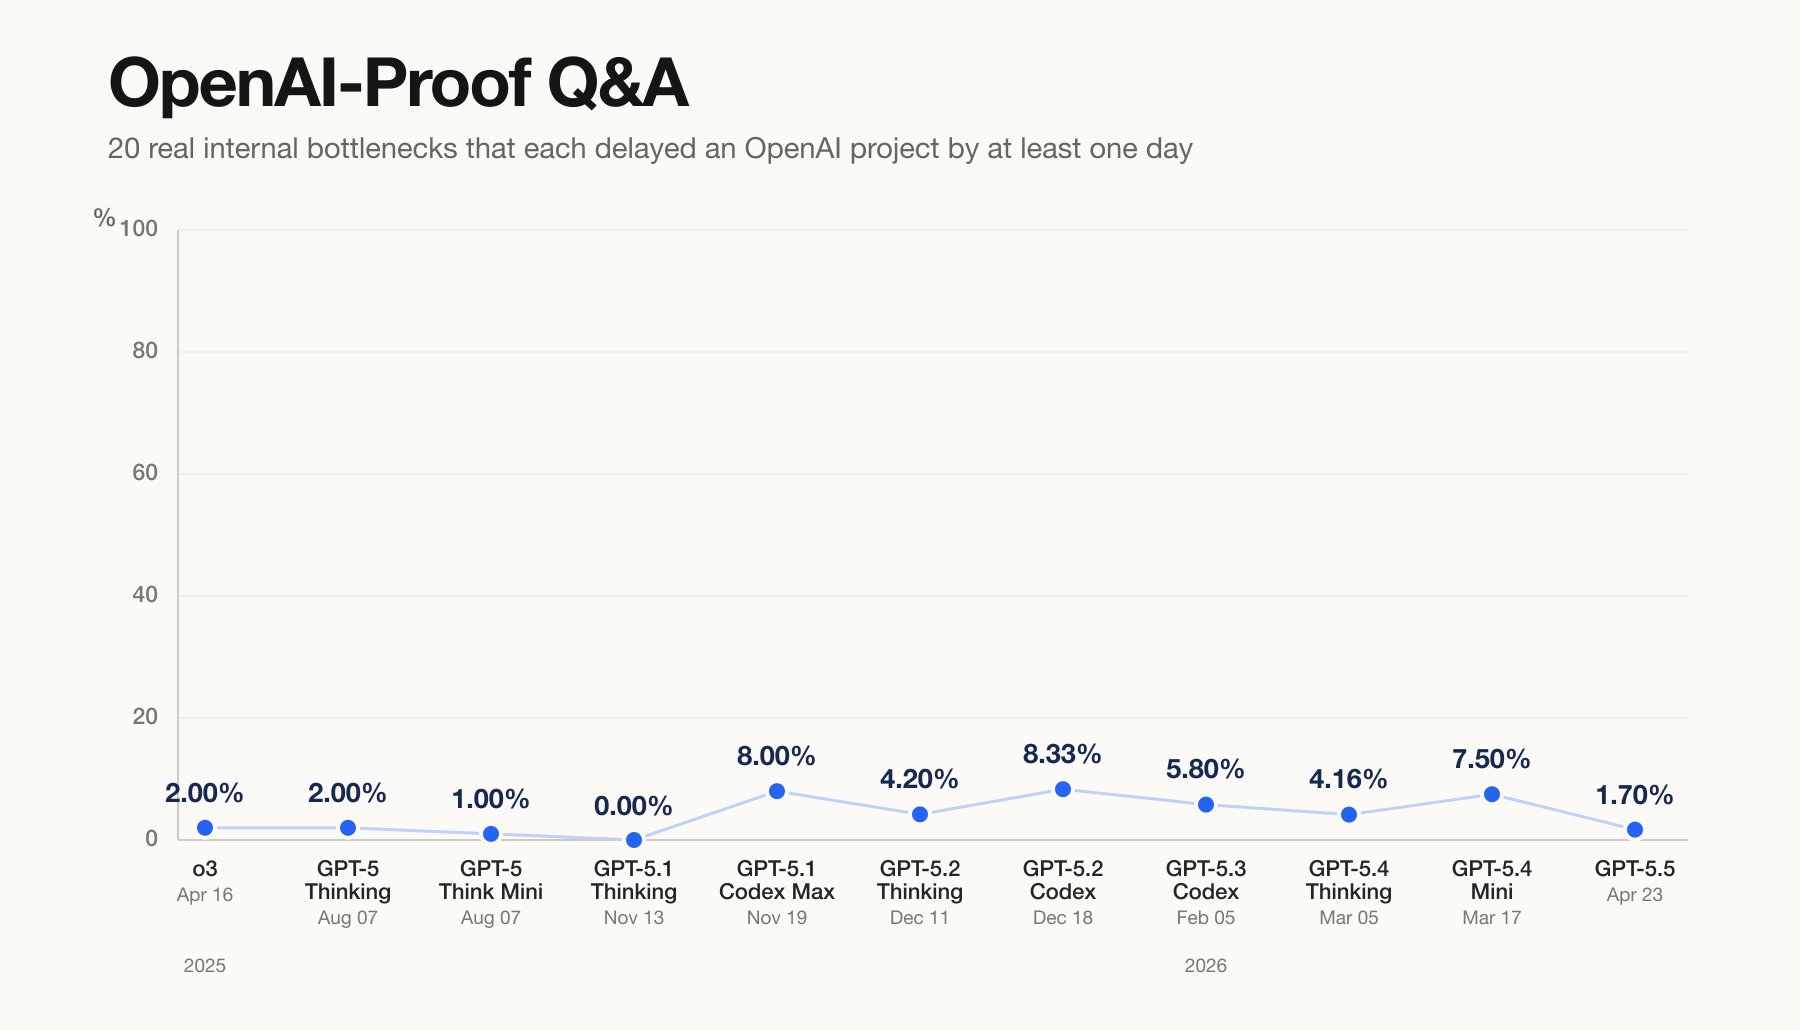
(EDIT: OpenAI has since deprecated ProofQA [“OPQA”], which apparently “upon review contained some problems that were not solvable under test conditions and thus made overall results harder to interpret”.)
And this is not just about individual benchmarks. Certain model updates, such as Kimi K2 0905, GPT-5.1, Gemini 3.6 Flash and Grok 4.3, represent performance declines on roughly half of the benchmarks supporting a comparison with their predecessor; for Kimi K2 0905, the share is about 60%. This project systematically tracks and investigates this phenomenon across more than 350 benchmark leaderboards.
Systematic review#
Applying this framework across more than 350 benchmark leaderboards, we find:
- When comparing model updates on the same benchmark, the newer version scores lower roughly one in five times (about 1,100 total declines), though declines are typically significantly smaller than gains: median improvements are more than twice as large as median drops. Among benchmarks reporting error estimates, about 170 declines are statistically confirmed regressions (compared to about 350 within noise bounds); the remaining majority nearly 600 lack error data to evaluate robustness.
- Decline rates vary widely across domains: performance drops are most rare in hard, verifiable fields like mathematics, software engineering, and agentic tasks, but more than double in soft domains such as writing and creativity.
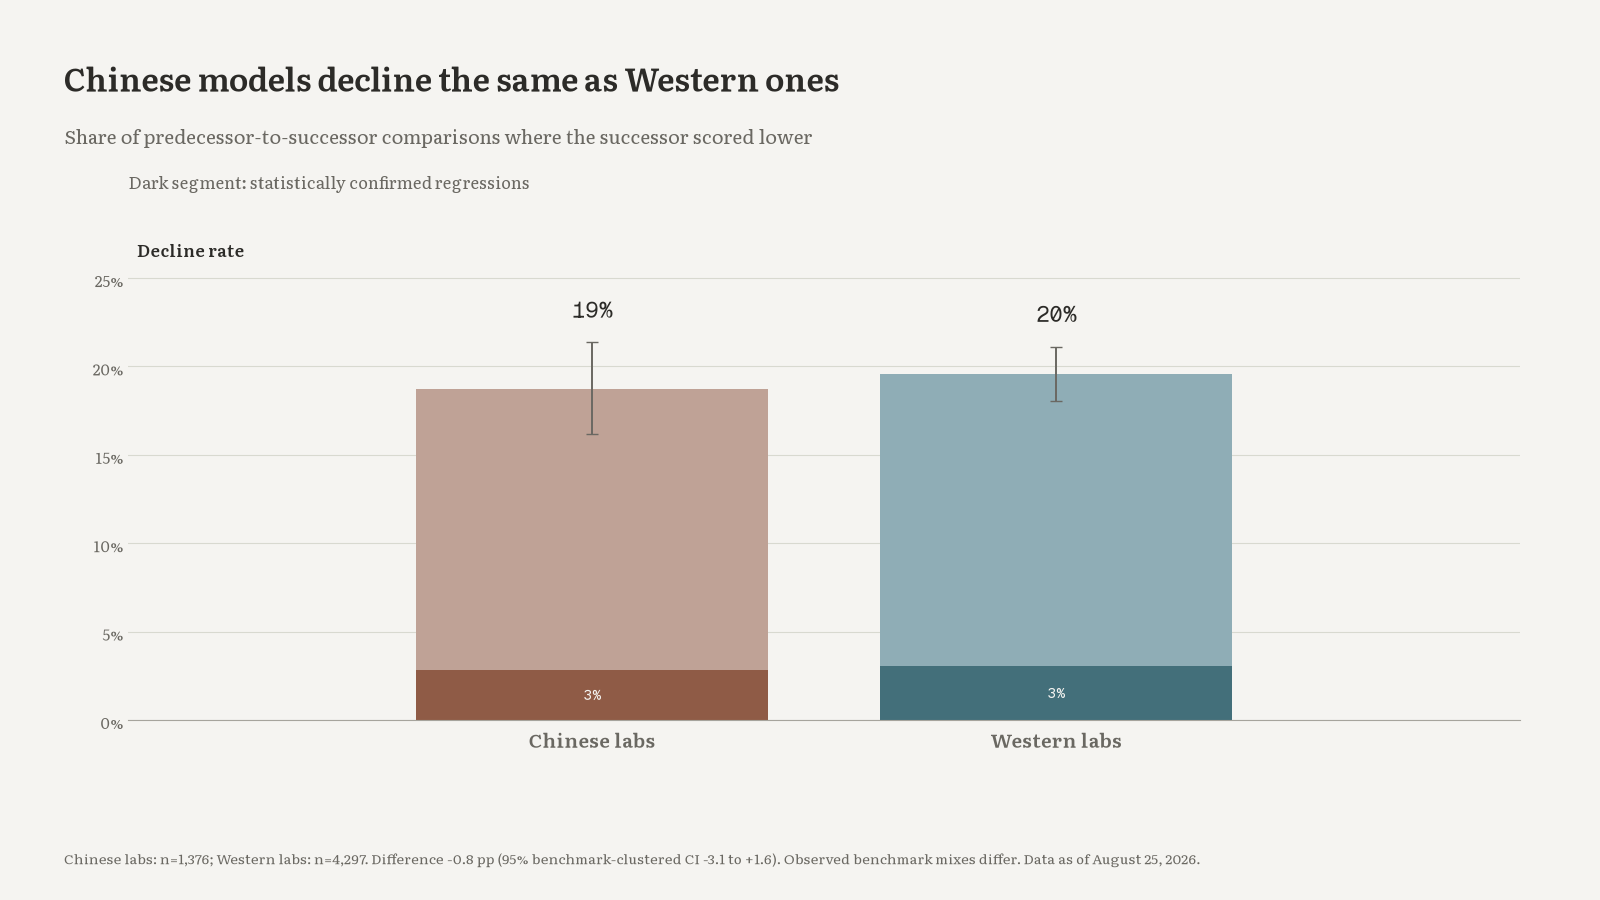
- Chinese and Western AI labs exhibit virtually identical rates of capability declines and regressions across both public and private benchmarks.
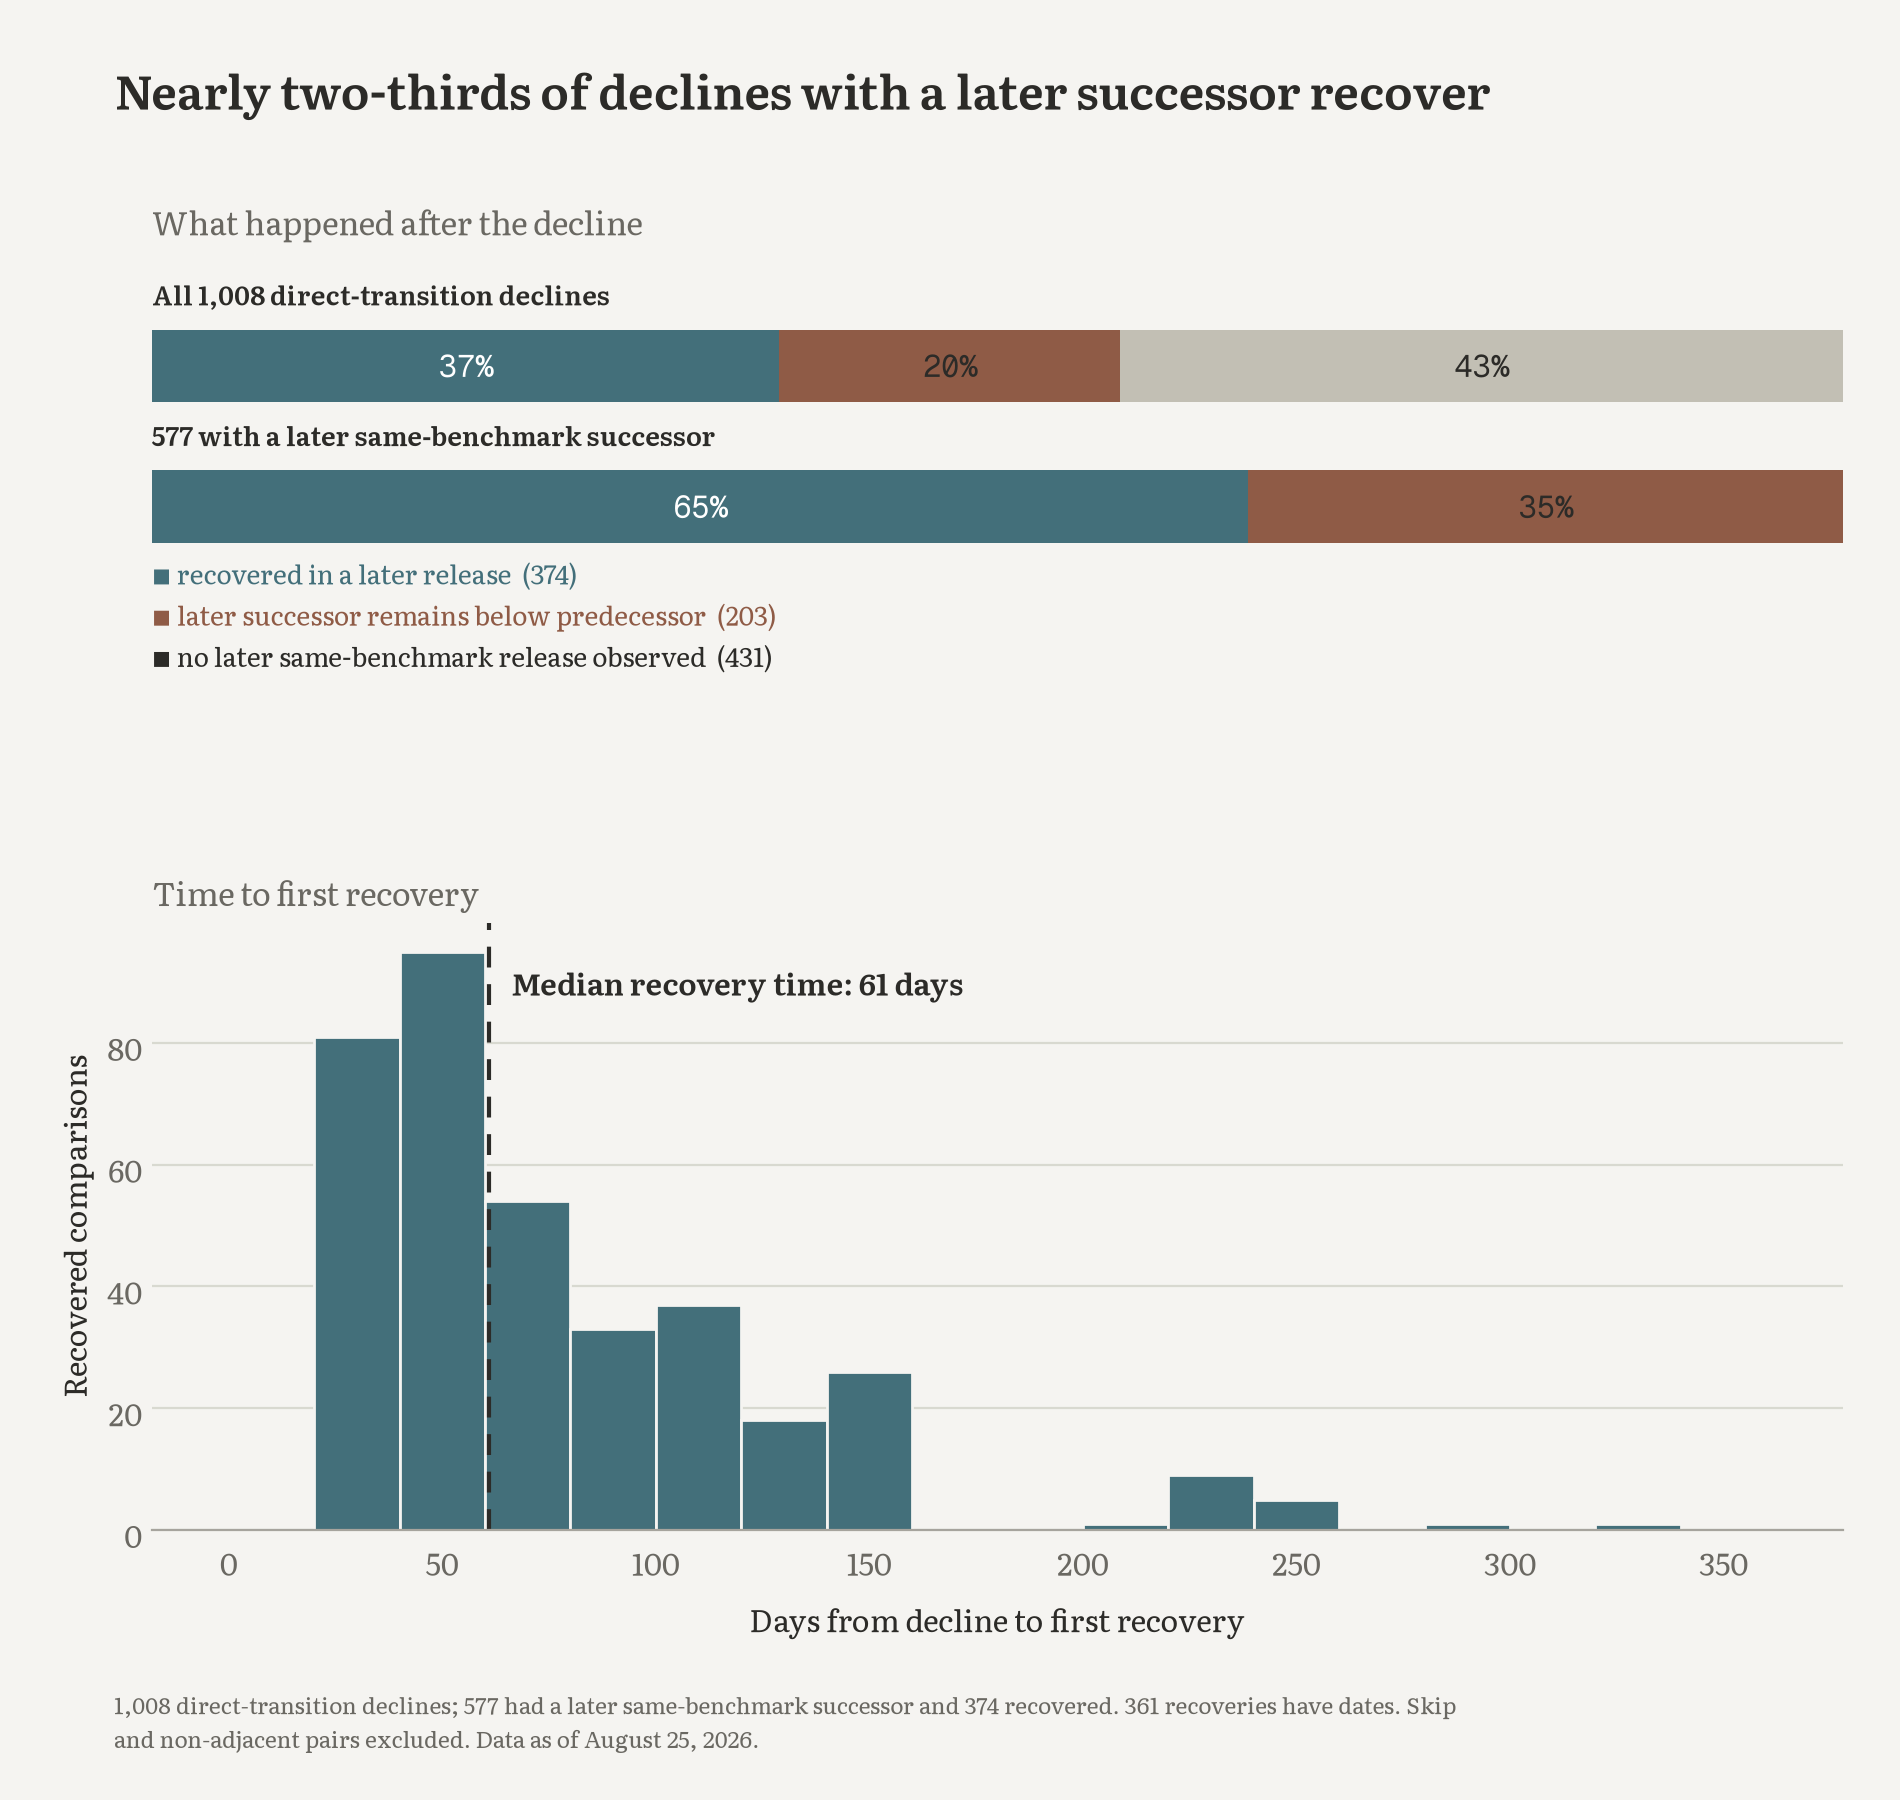
- Among declines where at least one further successor has been released, about two-thirds (65%) recover their losses in subsequent updates, with a median turnaround time of about 60 days.
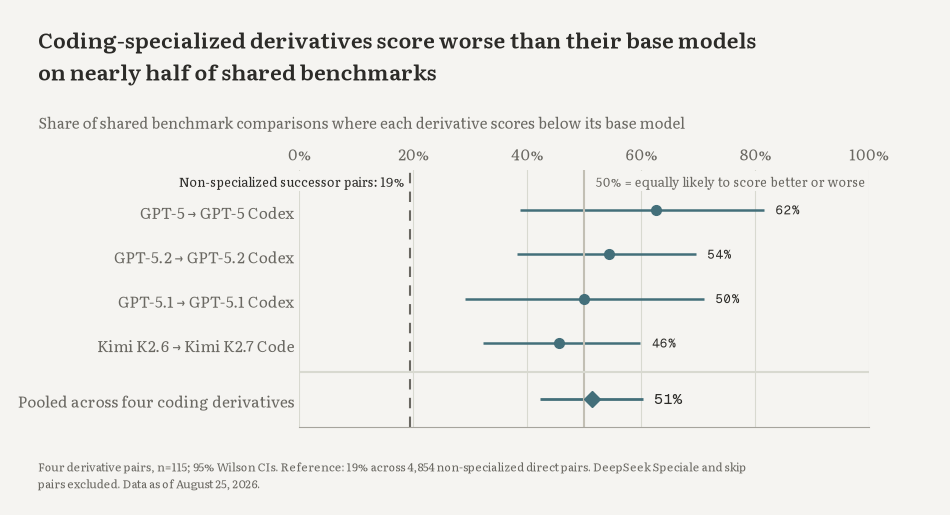
- Specialization appears to incur a capability tax: coding-specialized variants score lower than their more generalist base models on nearly half of shared benchmarks, more than double the decline rate of standard model updates.
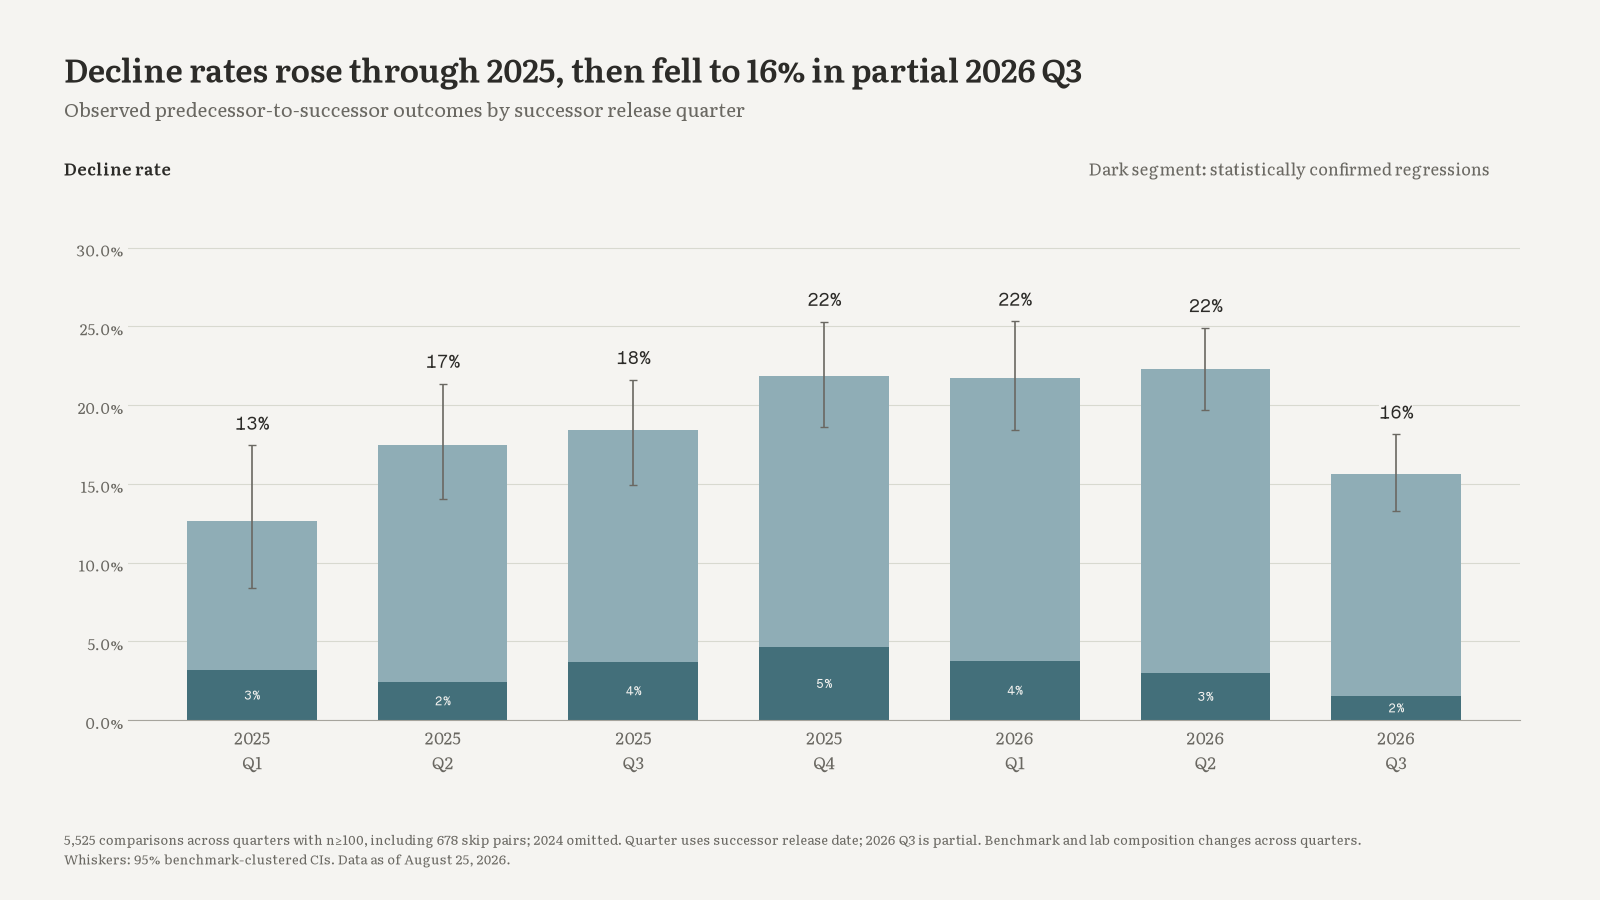
- Decline rates rose through 2025 before falling in partial 2026 Q3: performance drops increased from about 13% in Q1 2025 to about 22% by late 2025, stayed near 22% through Q2 2026, then fell to about 16% in the partial Q3 data. Note, however, that this is partly due to more frequent model updates in 2026.
- Performance drops appear to be at least in part a function of lab attention and economic incentives: raw score declines fall from about 25–26% on obscure or low-incentive benchmarks down to 13–15% on high-salience and economically central ones (though this pattern is not robust when filtering for confirmed regressions).
To support further research, we’ve made the full dataset available in a dedicated interactive explorer.
Case study: writing quality#
When specifically looking into writing capability across Claude Opus models, we find that Claude Opus 4.8 was likely a regression compared to its predecessor. Anthropic appears to have recovered the losses with the release of Opus 5, at least as far as the writing-related benchmarks we tracked go. However, this recovery appears to be, for the most part, in machine- (and, specifically, LLM-) scored benchmarks. Indeed, when looking at the only two human-rated writing benchmarks in our dataset (Surge AI’s Hemingway-Bench and LMArena’s Creative Writing), the former is mostly flat when taking confidence intervals into account, while the other shows Opus 5 still in a regression, at least when compared to Opus 4.6.
Limitations#
Crucially, we did not run these benchmarks ourselves: our dataset is compiled from official third-party benchmark leaderboards and public evaluation suites. (We only ran one benchmark – PokeAgent’s speedrunning challenge – as a follow up to claims of significant model improvements in Claude Plays Pokemon runs.)
About half of the leaderboards here do <10 model comparisons, which means that long-term tracking is concentrated in a handful of major benchmarks. And only ~40% of benchmarks publish error bars, vital for separating sampling error from actual regressions.
Interpretation#
What explains this? Is there anything to explain?
-
Blame RL? Unlike in our analysis of Composer 2.5, we don’t see a simple “RL post-training fries the model’s off-target capabilities” story here, since (base model, post-train) pairs don’t show a larger regression, and since there’s no clear pattern in e.g. general knowledge tests regressing.
-
Blame overtraining? In 2024 and 2025, parameter-count scaling was at most slow: outsider estimates suggest that Opus 4.5 and GPT-5.2 seemed to be a similar size to Opus 3 and GPT-4. So one story we could tell about the smaller models here is that they are trying to pack more capabilities into the same number of parameters and facing tradeoffs. We don’t assert this either.
-
Null hypothesis: Perhaps the above result - one fifth of the tests showing a median ~7% decline, and only 3% showing a statistically significant decline - does not really demand an explanation. Stronger individual cases (like the Composer 2.5 and Grok 4.3 collapses) can probably be chalked up to cost-saving, haste, and mistakes rather than anything fundamental about scaling or post-training.
See also#
- Our analysis of Composer 2.5, where RL was more likely the culprit.